Flarelight Platform - Your Data Analytics Hub
What is Flarelight?
Flarelight is your comprehensive data analytics and business intelligence platform. It's designed to help you turn your data into actionable insights through powerful import, preparation, analysis, and reporting tools - all enhanced with AI assistance to make your work more efficient and effective.
What You Can Do
With Flarelight, you can:
- Import Data from files, APIs, and external systems
- Prepare and Transform your data using visual tools and AI assistance
- Perform Statistical Analysis with a comprehensive suite of tests and methods
- Create Interactive Reports with customizable widgets and visualizations
- Automate Workflows to streamline your data processing
- Collaborate with Teams using role-based access and sharing
- Leverage AI Features for enhanced productivity and insights
Key Features
📊 Data Import
- File Upload: Import JSON, CSV, XML, and Excel files directly
- API Connections: Connect to external APIs with authentication
- Pre-built Connectors: Use connectors for popular services and platforms
- Scheduled Imports: Set up automatic data imports on your schedule
Example — My Imports View
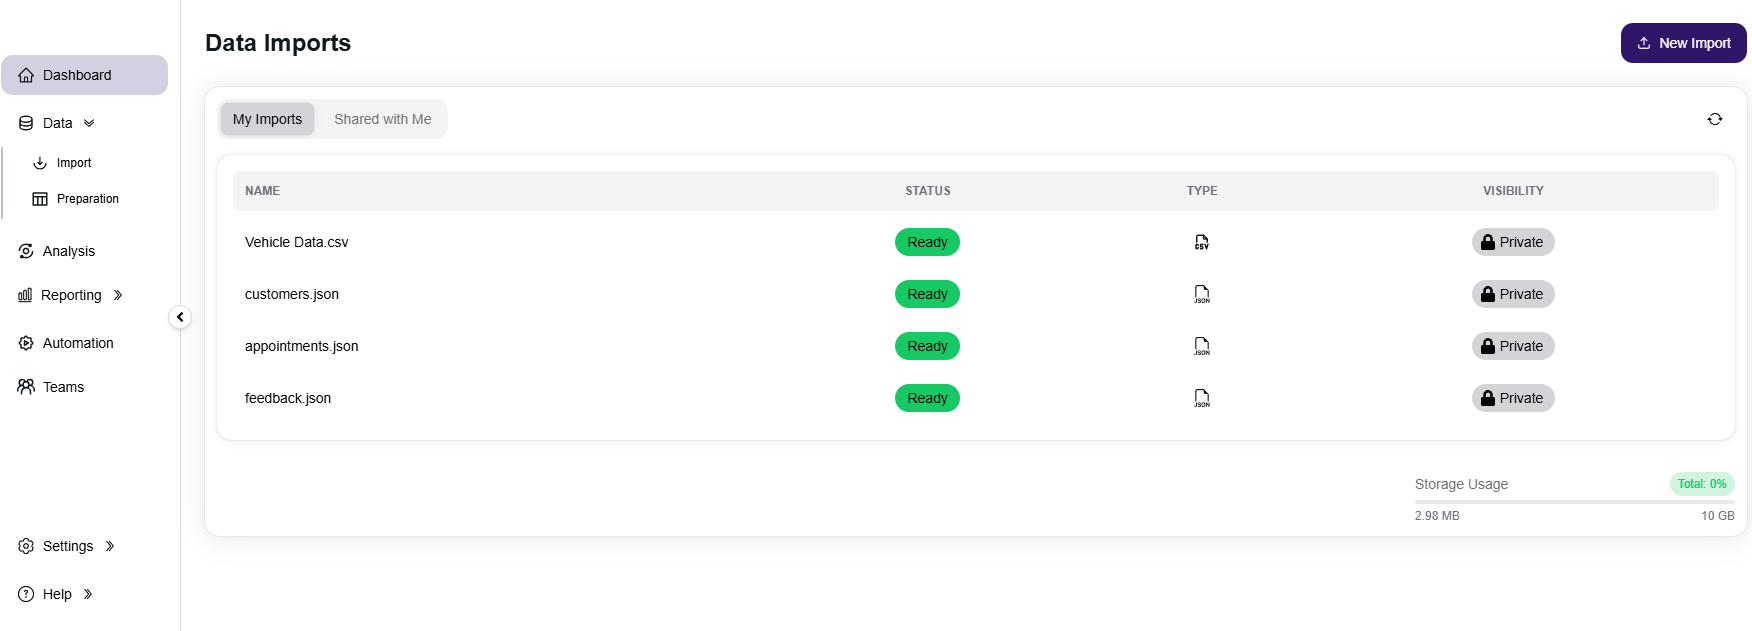
The My Imports view displays all data imports you’ve created, while the Shared with Me tab lists imports shared by other users or teams.
- Name: The dataset name as uploaded or created (e.g. Vehicle Data.csv).
- Status: Current import state — Ready, Processing, or Failed.
- Type: Indicates where the import came from, represented by icons:
- 📄 File: JSON / CSV / XML / Excel
- 🔌 API: Imported from an external API
- ⚙️ Automation: Created by an automation workflow
- 🧩 Connector: Google Sheets, SQL Server, PostgreSQL
- 🌐 Integration API: Data pushed through Integration API
- Visibility: Shows whether the import is Private (owner-only) or Public (available to others).
- Storage Usage: Visual indicator at the bottom showing your total storage used versus the limit allowed by your subscription.
📄 Data Import Details
The Data Import Details view provides full information about a specific import, including its metadata, storage usage, and data preview. From here, you can edit the import description, manage visibility, view audit history, and control webhook notifications.
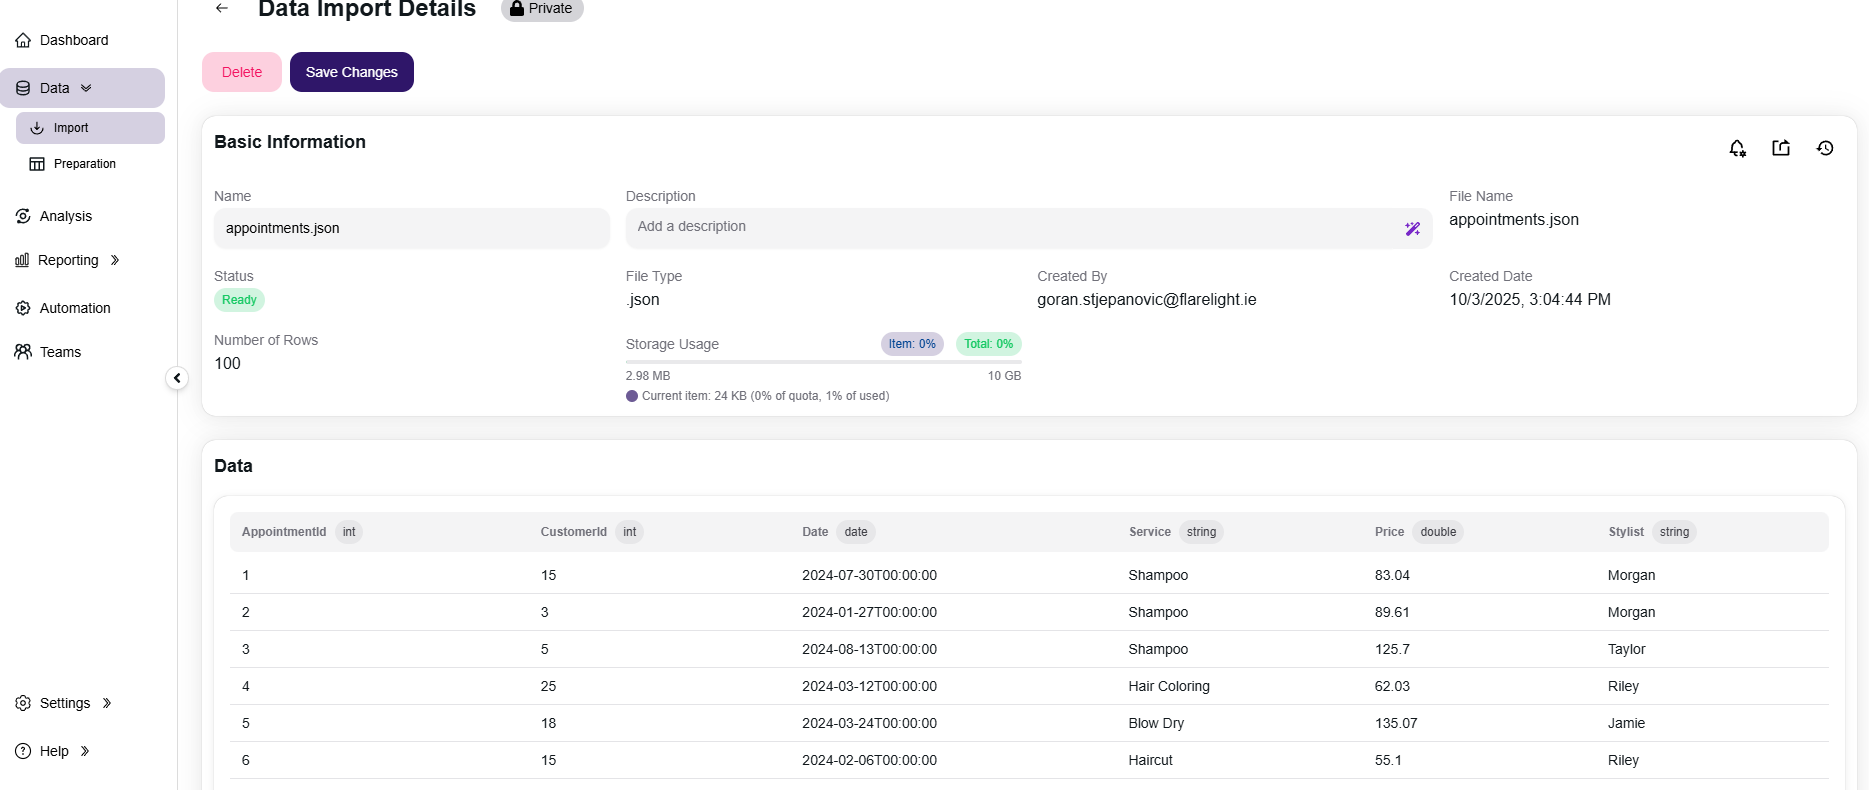
- Basic Information: Displays the import’s name, description, file type, row count, creation details, and current status.
- Status: Indicates whether the import is Ready, Processing, or Failed.
- File Type: Shows the detected file extension (e.g.
.json,.csv). - Number of Rows: Count of data records successfully imported.
- Storage Usage: Displays how much space this import occupies compared to your total used and available storage.
⚙️ Top Right Controls
- Event Settings 🔔 — Toggle whether this import sends webhook events (e.g. Import Ready, Import Failed).
- Share 🤝 — Manage sharing with other users or teams, allowing them to view or use this import in their own preparations or reports.
- History 🕓 — Opens the audit trail for this import, showing creation, updates, deletions, and other tracked actions.
🧾 Data Preview
The Data section below shows a live preview of the imported dataset, including column names, data types, and a sample of rows. This helps verify that the data was correctly parsed and loaded before using it in a Preparation or Analysis.
🔧 Data Preparation
- Visual Data Modeling: Create complex data models without coding
- Field Transformations: Apply functions like CONCAT, UPPER, LOWER, SUBSTRING, etc.
- Data Joins: Combine data from multiple sources with advanced filtering
- AI-Powered Suggestions: Get AI recommendations for data transformations
- Merge Data Sources: Merge data from multiple sources with advanced filtering
- Pivot Tables: Create pivot tables with advanced filtering
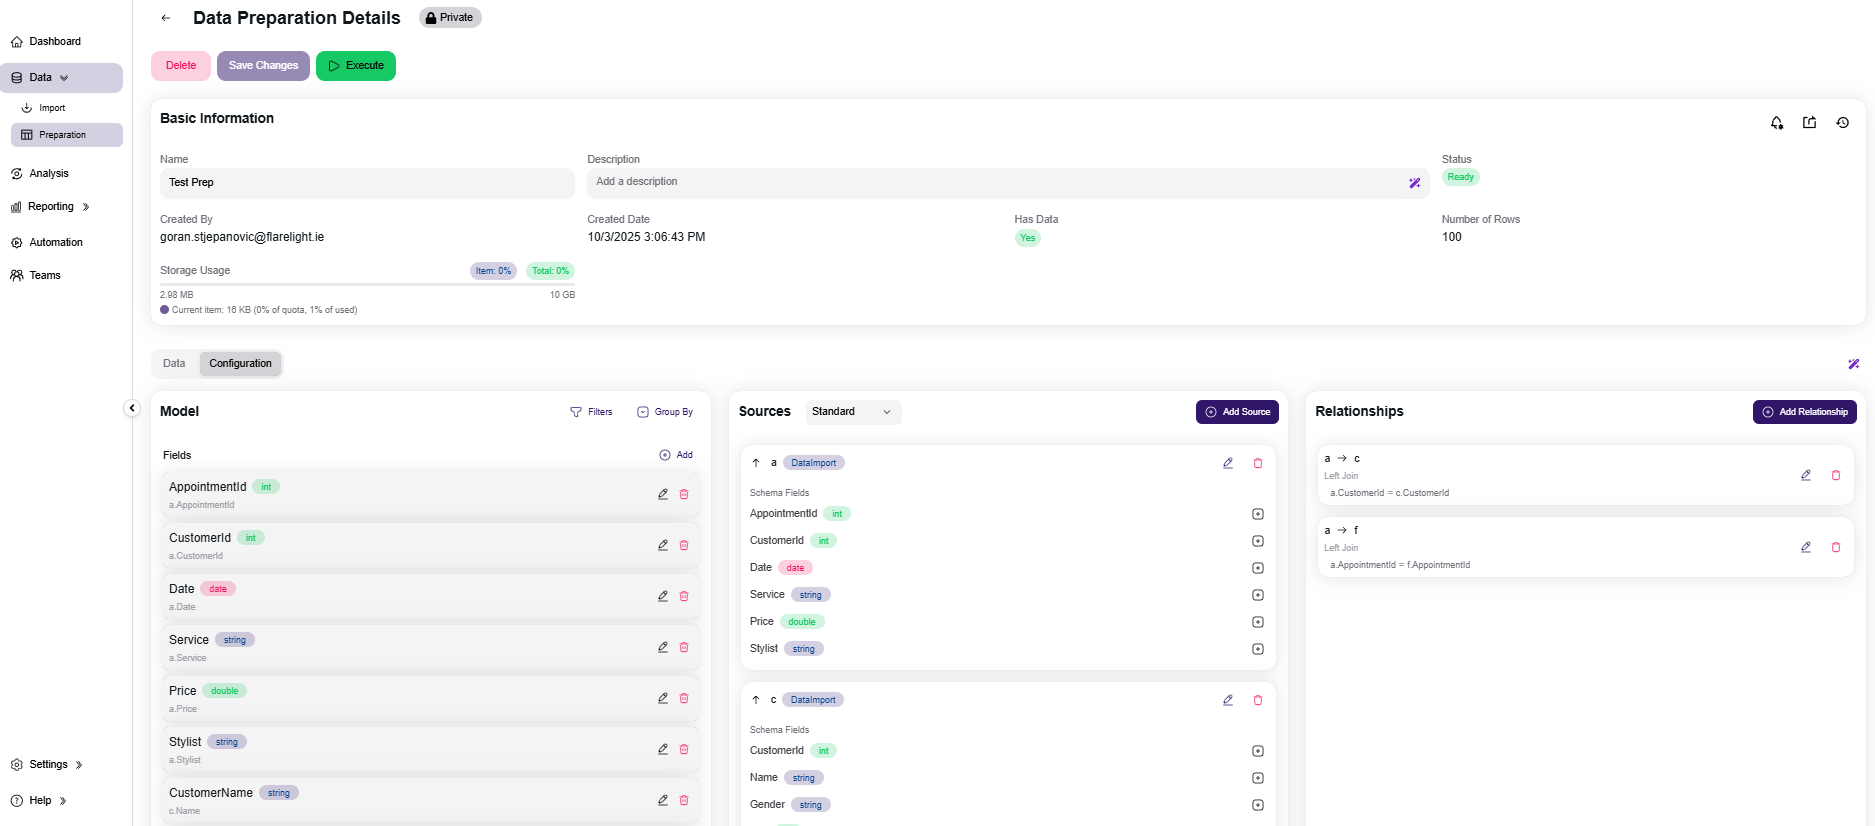
- Basic Information: Displays metadata such as name, description, status, row count, creator, and creation date. You can also view overall and per-item storage usage for this preparation.
- Status: Indicates the current state of the preparation — Ready, Processing, or Failed.
- Storage Usage: Shows how much space the resulting dataset occupies compared to your total usage and subscription limit.
- Has Data: Indicates whether the preparation has been executed and contains data ready for preview or downstream use.
⚙️ Top Right Controls
- Event Settings 🔔 — Toggle whether to send webhook events (e.g. Preparation Ready or Preparation Failed) when executed.
- Share 🤝 — Share the preparation with other users or teams to allow collaborative analysis or reporting.
- History 🕓 — Access the full audit trail showing configuration changes, executions, and updates.
🧮 Configuration Tabs
- Data: Displays a preview of the resulting dataset after execution, including all output fields and sample rows.
- Configuration: Defines the data model using three sections — Model, Sources, and Relationships.
🧱 Model Configuration
- Model: Lists the output fields of the preparation, including name, type, and source reference. Fields can be added, renamed, or derived using expressions and functions.
- Sources: Defines one or more input datasets — imports or other preparations — that feed into the model. Each source includes its schema fields and can be joined or merged with others.
- Relationships: Shows how sources are joined together. Each join displays the relationship type (e.g. Left Join, Inner Join) and the join condition between fields.
✨ AI Configure (Prompt → Preparation)
Use AI to generate a full preparation configuration from a natural-language prompt. The assistant considers available sources (names, descriptions, and schemas) and proposes fields, joins, filters, group by, and basic expressions.
- How to launch: Click the sparkle button in the Configuration area to open the prompt panel.
- What AI uses: Source metadata only (names, descriptions, schemas & data types).No raw row data is sent.
- What you get: A proposed model with output fields, selected sources, join relationships, optional filters/aggregations, and suggested data types.
Tips for great results
- Mention source names and join keys explicitly (e.g.,
a.CustomerId = c.CustomerId). - Specify the output you want: fields, filters, groupings, and aggregates.
- Note any data type expectations (e.g., “Price as double, Date as date”).
▶️ Execution
Click Execute to run the preparation and generate the output dataset. Once executed, it becomes available as a source for Analysis or Reporting, and a newPreparation Ready event can be triggered for connected automations or webhooks.
📈 Statistical Analysis
- Descriptive Statistics: Mean, median, min, max, standard deviation
- Correlation Analysis: Pearson and Spearman correlation methods
- Hypothesis Testing: One-sample, two-sample, and paired tests
- ANOVA Testing: One-way ANOVA and Welch's ANOVA
- Non-parametric Tests: Wilcoxon, Mann-Whitney U, Kruskal-Wallis
- Normality Tests: Shapiro-Wilk, Kolmogorov-Smirnov, Anderson-Darling
📋 Interactive Reporting
- Custom Layout Builder: Create reports using an intuitive interface
- Multiple Widget Types: Tables, charts, KPIs, text, etc.
- AI-Generated Insights: Get automated insights and summaries
- Export Formats: Export reports as PDF or widgets as images
⚡ Workflow Automation
- Visual Workflow Designer: Build automations with drag-and-drop
- Various Standard or App Based Triggers: Manual, scheduled, data import, preparation, etc.
- General Nodes: Switch, Custom Code, API Call
- App Nodes: Import Data, Execute Preparation, Generate Report, Run Analysis
- Execution History: Track automation runs and results
👥 Team Collaboration
- Team Management: Create and manage teams within your organization
- Role-based Access: Control who can access what with granular permissions
- Resource Sharing: Share data, analyses, and reports with team members
- AI Descriptions: Generate team descriptions and documentation
AI-Powered Features
Flarelight includes AI assistance throughout the platform:
- Smart Descriptions: Generate descriptions for teams, reports, and resources
- Data Preparation Help: Get AI suggestions for data transformations
- Report Configuration: Use AI prompts to set up report configurations
- Report Insights: Generate insights from your report data
- Error Explanations: Get clear explanations when things go wrong
Getting Started
Your First Steps
- Import Your Data: Start by uploading files or connecting to data sources
- Prepare Your Data: Clean and transform your data using visual tools
- Run Analysis: Perform statistical analysis to gain insights
- Create Reports: Build interactive reports to visualize your findings
- Set Up Automation: Automate repetitive tasks to save time
- Invite Your Team: Collaborate with colleagues and share resources
Platform Overview
Main Navigation
- Dashboard: Overview of your data, analyses, and reports
- Import: Manage data imports and connections
- Preparation: Transform and prepare your data
- Analysis: Run statistical tests and analysis
- Reports: Create and manage interactive reports
- Automation: Set up and manage automated workflows
- Teams: Manage team members and permissions
Support & Resources
Getting Help
- In-app Help: Use the help system built into the platform by navigating to Help/Report an Issue
- Feedback System: Suggest improvements and new features
Contact Support
- Email: support@flarelight.io
- Platform Issues: Use the built-in issue management system
- Feature Requests: Submit suggestions through the feedback system
- Training: Request training sessions for your team
Ready to Get Started? Flarelight is designed to make data analytics accessible to everyone. Whether you're a business analyst, data scientist, or team manager, you'll find powerful tools that help you turn data into decisions. Start with importing your first dataset and explore the platform's capabilities.